Planck's Law of Black-body Radiation
Interactive plot of Planck's Law


Anyone who's ever used a toaster will have noticed that when the heating elements get hot, they start to emit light. Initially, when they're warming up, the colour is dark red. When they get hotter, they get brighter, and the colour is more orange.
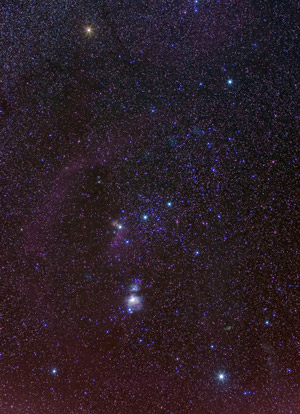
Similarly, next time you're stargazing, take a look at Orion. You might notice that the bottom right star (Rigel), appears bluish, whereas the top left star (Betelgeuse) appears more red.
The light emitted by the stars and the toaster's heating elements can be modelled by the black-body radiation curve at the top of the page.
Where
- \( B \) is the spectral radiance
- \( T \) is the absolute temperature of the object
- \( \lambda \) is the wavelength
- \( h \) is Planck's constant
- \( c \) is the speed of light
- \( k_BT \) is Boltzman's constant
Our eyes can detect radiation that has a wavelength from around 380nm to 740nm. Our eye combines all the intensities in this region together and we perceive this as a colour.
In the user interface above, there is an option to display Wien's displacement law. This law demonstrates how in the blackbody curves above, the peak wavelength for each curve, \( \lambda_{peak} \), is inversely related to the temperature, \( T \) where \( b \) is a constant known as Wien's displacement constant, equal to \( 2.897771955...\times 10^{-3} \textrm{mK} \)
\[ \lambda_{peak} = \frac{b}{T} \]
Picture credits: Picture of Orion taken from Wikipedia